


Brits cite rent, or mortgage expenses, as the fourth most common reason for the ongoing cost of living crisis in the UK, according to a study by the Office of National Statistics (ONS) released on 14th July 2023. Unsurprisingly, it also emerged that around 43% of tenants struggle to afford their monthly payments.
The team at PromptCleaners analysed rental data from the Greater Manchester area and found that in the year preceding May 2023, the mean monthly rental price in the metropolitan county saw an increase of 9.89%, up from £758 to £833. In some boroughs, prices have jumped even further, with Salford having the greatest increase of 11.18% (from £787 in 2022 to £875 in 2023).
How are locals coping with the situation, and which Greater Manchester boroughs are the best and worst for renting a home? This study analyses rent and salary data provided by the ONS.
Methodology
We consulted the Office of National Statistics and used its most current statistical data, namely Employee Earnings in the UK and Index of Private Housing Rental Prices, UK, to analyse the data pertaining to the Greater Manchester area.
As the ONS provides average rental prices per month, and salaries per week, our team multiplied the weekly average pay by 4 to make the data more consistent. Efforts have been made to ensure monthly pay figures are as precise as possible, however, they should be considered estimates.
Our team at PromptCleaners took into account all publicly available data on mean pay for employees, including those working both full-time and part-time. This report includes information about the metropolitan boroughs of Manchester, Salford, Stockport, Oldham, Bury, Bolton, Rochdale, and Wigan.
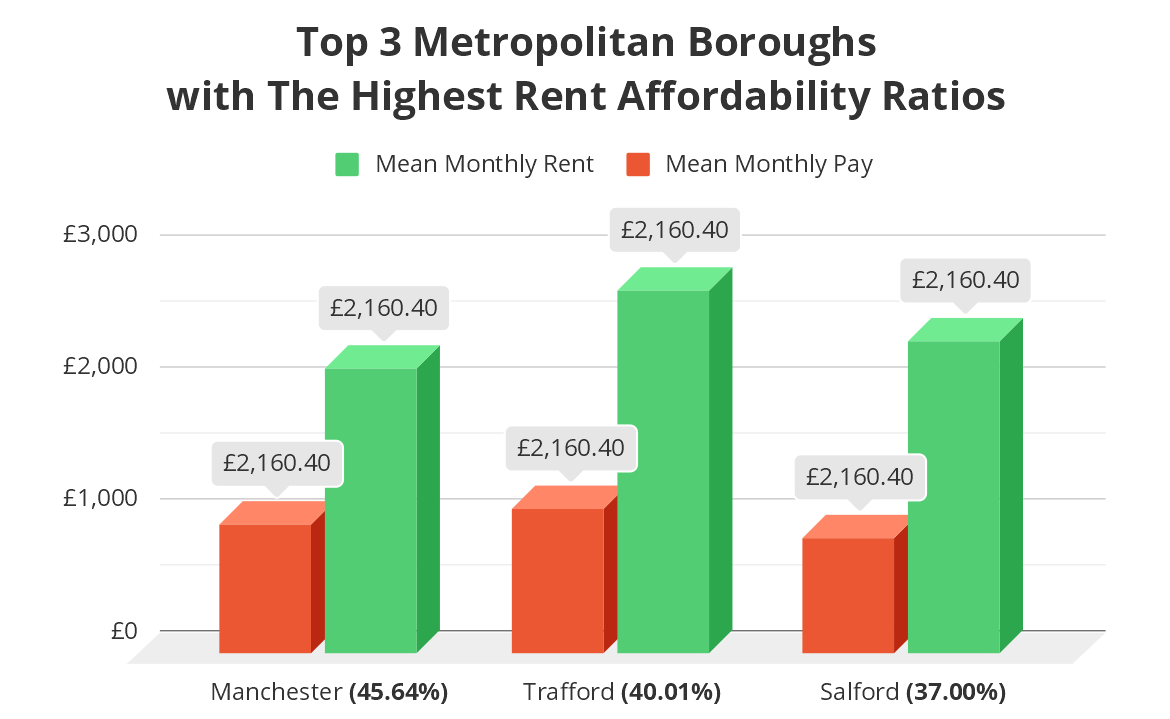
Greater Manchester Metropolitan Boroughs with the Worst Rent Affordability Ratio
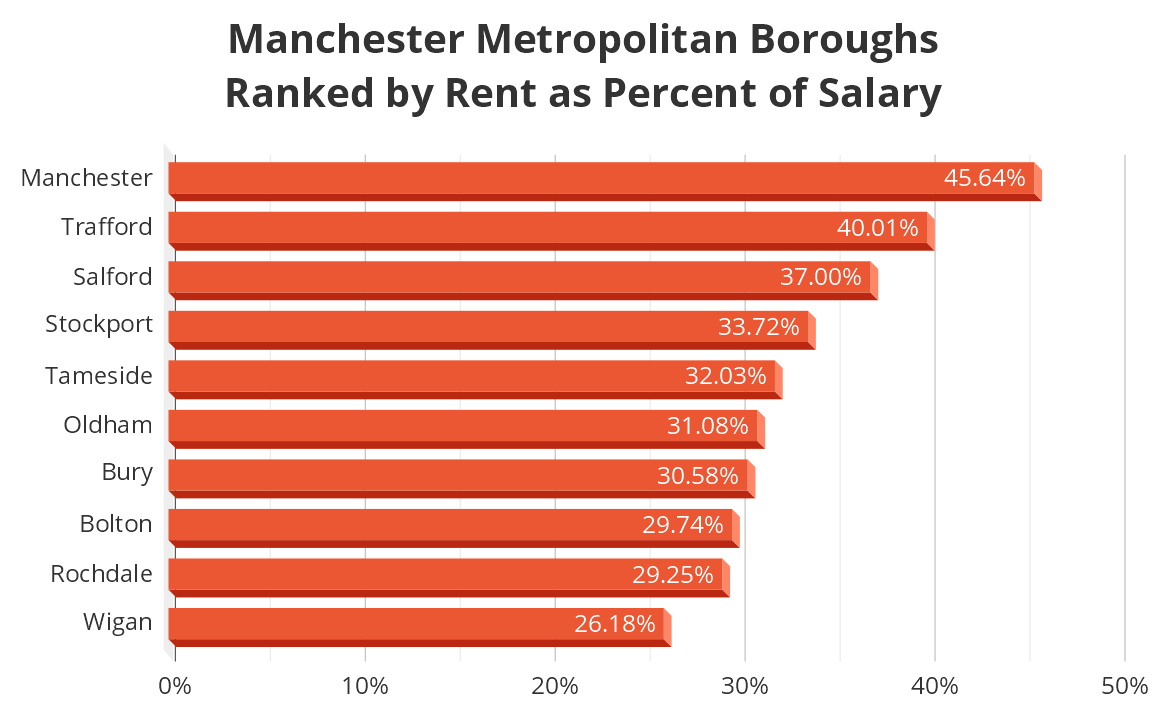
According to the ONS, the Northwest of the UK, where Greater Manchester is located, is the 4th most advantageous English region in which to rent a home. The rent affordability ratio of 31.4% in the Greater Manchester area means that renters spend an average of 31.4% of their monthly salaries on rent. In some of Manchester’s boroughs, however, the percentage of salaries local employees spend on rent is considerably higher. This is particularly the case in the city of Manchester where 45.64% of the average monthly salary is spent on rent.
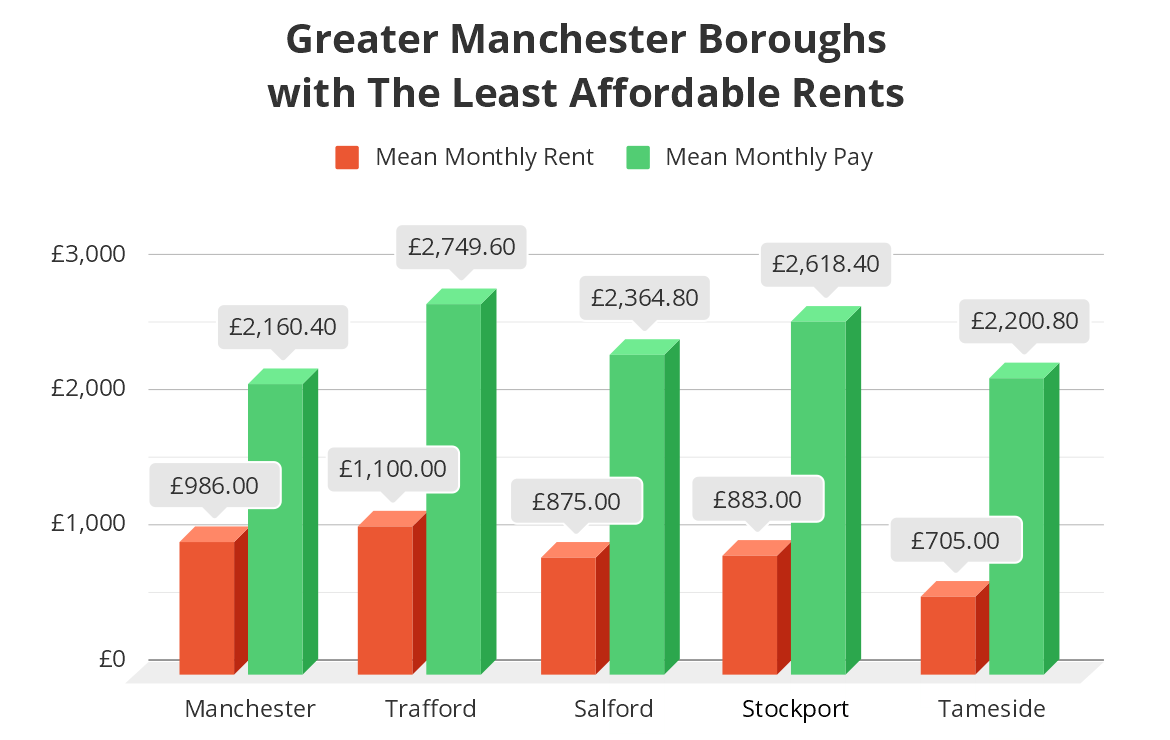
Manchester – £986 Mean Monthly Rent vs £2,160.40 Mean Monthly Pay
A major cause of the worsening rent affordability ratio in Manchester, and the other metropolitan boroughs, is that salaries are increasing at a rate considerably slower rate than rent. According to the ONS, between October 2021 and October 2022, the city of Manchester’s mean monthly salary only rose by 3.33%, from £2,088.4 to £2,160.40. This makes this borough the worst for renting a property, with the highest mean monthly rent of £986, and the second lowest mean monthly pay of £2,160.40, creating a rent-salary ratio of 45.64%.
Salford – £875 Mean Monthly Rent vs £2,364.80 Mean Monthly Pay
Salford has had the highest rental price increase in the last 12 months, rising by 11.18%. However, Salford has the second highest average percentage of salary being spent on rent, coming in at 37%, as mean rental prices are lower than in Manchester city, at £875, while average pay is slightly higher at £2,364.80. Interest in living in Salford is expected to grow, as the English Cities Fund and the University of Salford have recently announced the first phase of a project bringing forward a £2.5bn scheme featuring the development of 933 new homes, among other initiatives.
Stockport – £883 Mean Monthly Rent vs £2,618.40 Mean Monthly Pay
The top 3 of the worst Manchester metropolitan boroughs to rent a home is rounded up by Stockport, where the £883 mean monthly rent accounts for 33.72% of the last officially published average monthly salary of £2,618.40. The annual rental price increase is estimated at 10.93%, the second highest in the Greater Manchester metropolitan county.
The Most Affordable areas to Rent a Home
Renters deciding to head to Wigan, Rochdale, or Bolton looking for a rental property could not put a foot wrong, as these are the top three areas offering the best rent affordability ratios, of 26.18%, 29.25%, and 29.74%, respectively. Although to a lesser extent, Bury and Oldham also show reasonable figures.
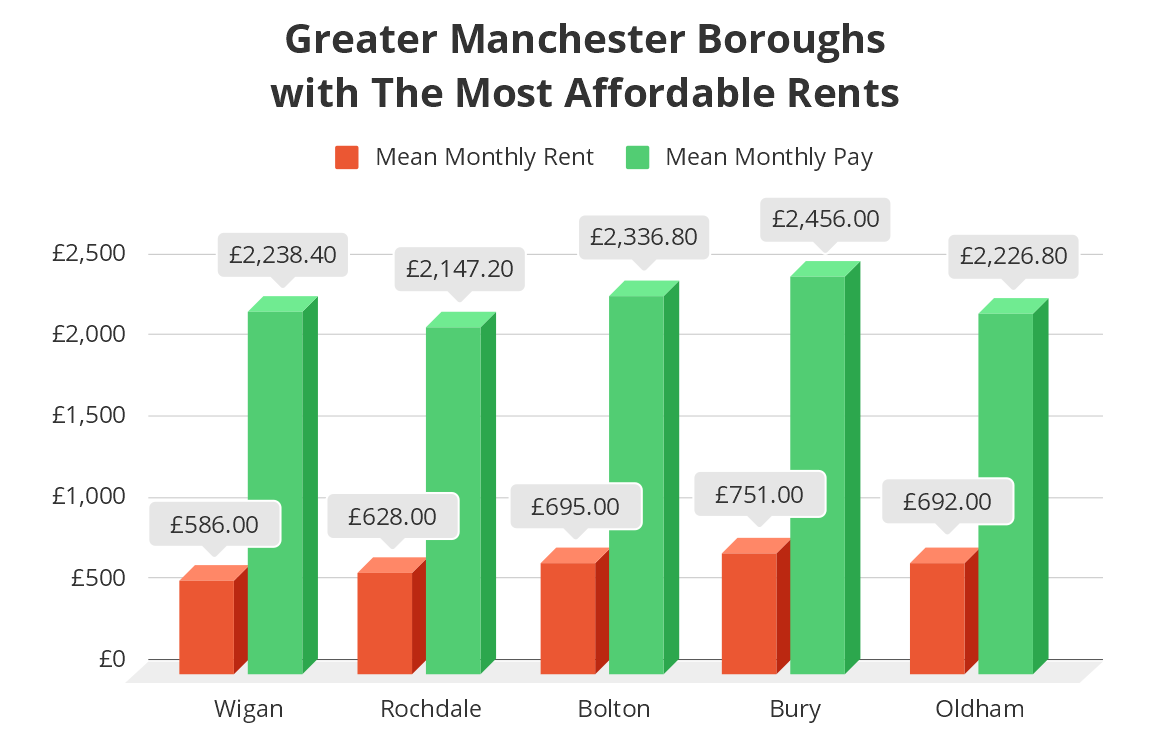
Wigan – £586 Mean Monthly Rent vs £2,238.40 Mean Monthly Pay
Wigan is the best location to rent a home for those wishing to have more money left after making their monthly rent payments. As the second most populous district in Greater Manchester, with 329,800 residents, Wigan boasts the best rent affordability ratio with as little as 26.18% of mean monthly pay being enough to cover the average rental cost of £586, the lowest in the metropolitan county.
Rochdale – £628 Mean Monthly Rent vs £2,147.20 Mean Monthly Pay
Rochdale is another Greater Manchester borough currently in high demand. Although rental prices are soaring here too, but with an increase of 8.46% within the past year, the area is still considered an affordable alternative to Manchester city, Salford, and Stockport. According to ONS, the mean monthly pay in the metropolitan borough is £2,147.20, of which, the £628 mean monthly rent is 29.25%.
Bolton – £695 Mean Monthly Rent vs £2,336.80 Mean Monthly Pay
Having a mean monthly pay of £2,336.80 and rental prices averaging £695, Bolton is the third most affordable Greater Manchester borough for renting a home. Along with Bury, Bolton has shown the greatest consistency in the metropolitan county when it comes to the rent-salary ratio. In comparison to the same time last year, the percentage of pay needed to cover the mean monthly rent has remained almost unchanged at 29.74%, vs 29.95% in 2022.
Bury – £751 Mean Monthly Rent vs £2,456 Mean Monthly Pay
In the 12 months to May 2023, Bury saw the second lowest annual rental price increase in Greater Manchester of 8.06%, up from £695 to £751, only coming in behind Wigan with its increase of 6.55%. The current mean rental price accounts for 30.58% of the average pay in the borough of £2,456. While not insignificant, this figure is far behind Manchester’s 45.64%.
Oldham – £692 Mean Monthly Rent vs £2,226.80 Mean Monthly Pay
Oldham is the last metropolitan borough on the lower end of the rental market in Greater Manchester with its rent affordability ratio estimated at 31.08%. According to ONS, mean monthly rent prices averaged £692 in May 2023, with only the residents of Rochdale and Wigan enjoying lower rates.
