


England homeowners were reducing their asking prices by an average of £11,011 (-2.81%) over the last 12 months
Home sellers in the SW3 (London) postcode dropped their prices by an average of £-145,480 (-5.21%) secure a sale
Professional we buy any house firm Property Solvers has revealed the areas in England where home sellers have been reducing their prices the most.
Tracking 72,982 property transactions between October 2020 and October 2021, the monthly updated asking vs. sold price difference tool shows the average differences between asking prices on Rightmove and their actual sold prices lodged at the HM Land Registry.
The data therefore monitors the entire house sale process from initial listing, viewings, negotiation, offers, agreement through to the survey process, conveyancing, exchange and finally completion.
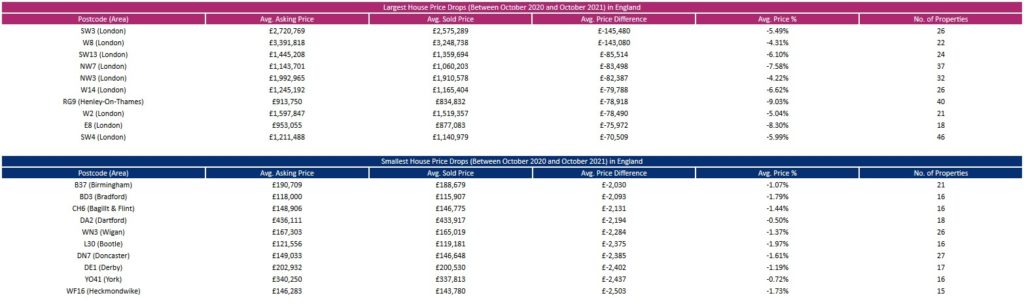
Taking a minimum average of 15 property sales (to not skew the results), some of the biggest price discounts in England were seen in the SW3 (London) postcode. Across this region, 26 sellers were knocking off an average of £-145,480 (or -5.21%) from the initial asking price in the 12 months to October 2021.
Over the same period, the lowest hits on price were seen in B37 (Birmingham), where 21 home sellers reduced their properties by an average of £-2,030 (or 1.06%) to get the sale going.
Based on a minimum of 15 average sales, the tables below show some of the more interesting trends.
Co-founder at Property Solvers Ruban Selvanayagam says: “despite what has been a very active market, homebuyers are still, by and large, able to negotiate down on prices. There is also wider evidence of surveyors down valuing properties that are misaligned with the realities. This means that properties end up selling for lower than the original estate agent price estimation.”
It’s relative of course, a more expensive property is likely to see a wider price difference. Nonetheless, when buying, it’s worth checking how much prices are being reduced in your area using our tool.”
“For sellers, before listing, we always suggest looking at the widely available free data from HM Land Registry which tracks the prices properties are sold for and not what they are advertised for.”
Selvanayagam concludes: “This tool will be updated on a monthly basis so sellers can see how realistically homes are being priced in their own postcode.”
